Anúncios
In today’s fast-moving tech world, keeping your computer’s vital hardware in check is more important than ever. As someone with over 20 years’ experience writing copy in the technology niche, I’ve seen how poor monitoring leads to throttling, instability, and shortened hardware lifespan. In this post we’ll walk through how to monitor your CPU and GPU temperature and usage on your PC, step-by-step, with actionable advice you can apply today on your site ADCOD.
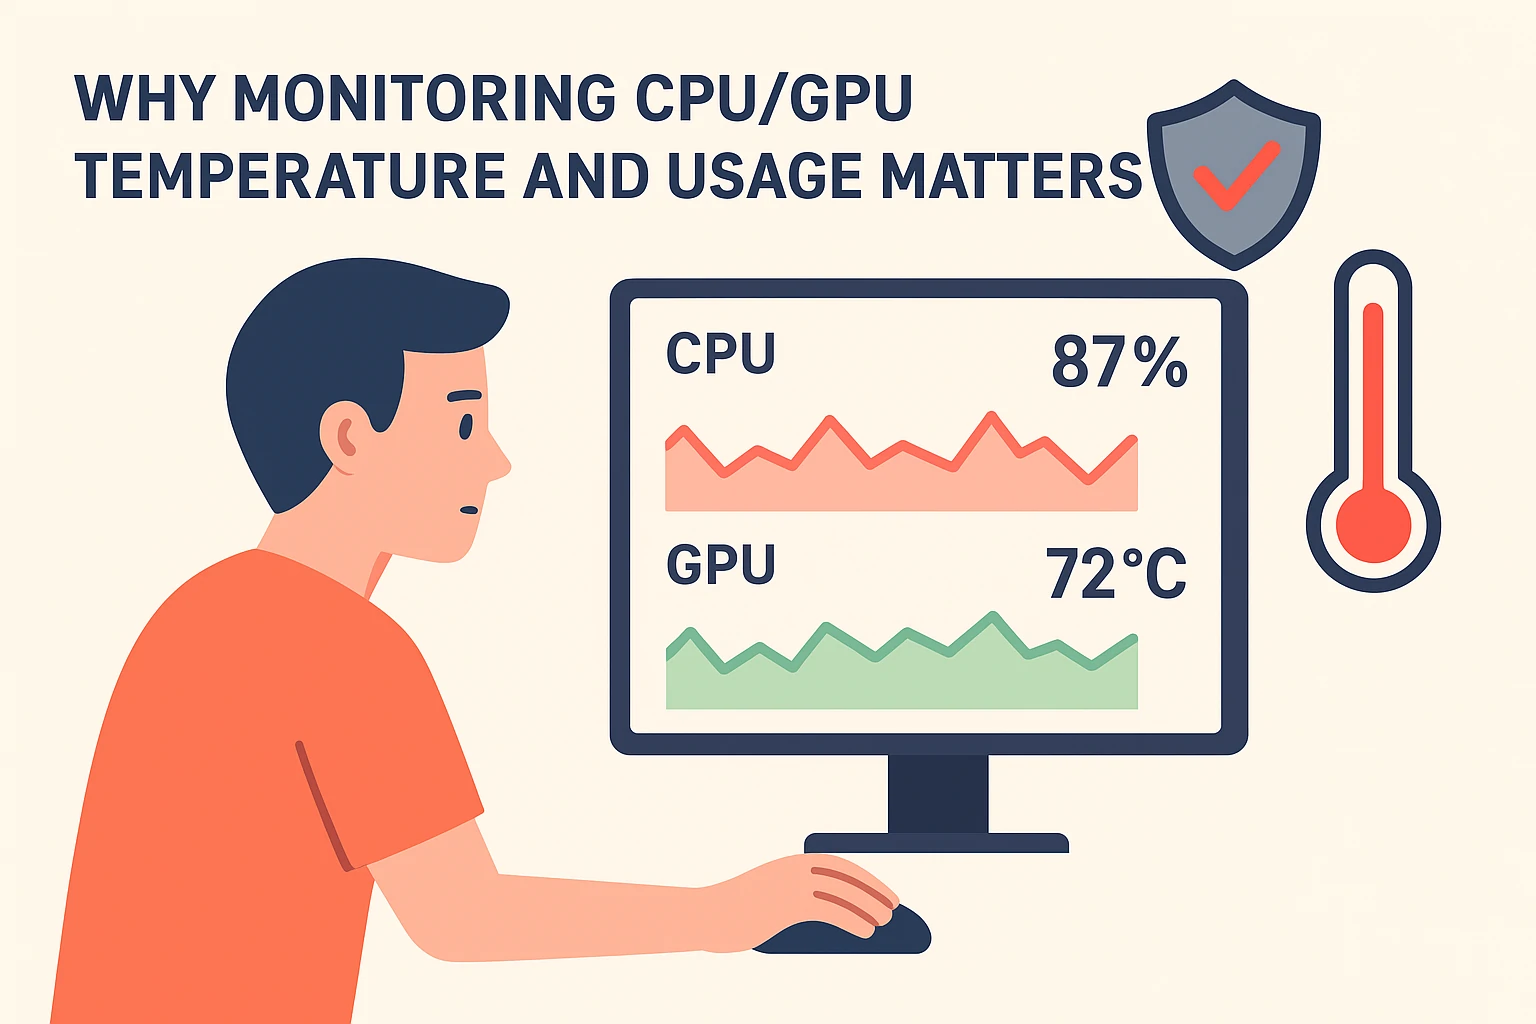
Why Monitoring CPU/GPU Temperature and Usage Matters

Your CPU (central processing unit) and GPU (graphics processing unit) are the workhorses of your machine. They generate heat when working, and when usage goes high for long periods, temperature climbs. Without good monitoring:
Anúncios
-
Your system may throttle, reducing performance to stay within safe thermal limits.
-
Long-term exposure to high temperature can reduce component lifespan.
-
Unexpected usage spikes can signal hidden problems: malware, runaway processes, or failing cooling.
-
For gamers, creators or enthusiasts, monitoring usage (in real time) helps ensure you’re getting full value from your hardware.
Ensuring you see what your hardware is doing is the first step to better performance and reliability.
Core Concepts: Usage vs Temperature
CPU/GPU Usage
Usage refers to how much of your CPU or GPU’s capacity is being used at a given moment. For example: 100% usage on CPU means it is fully occupied processing tasks. Monitoring usage tells you if your hardware is being stressed, idle or somewhere in between.
Anúncios
Also read: Does dual monitor affect GPU temperature?
Temperature
Temperature is the thermal reading of the hardware. Even at modest usage, poor cooling, dust or bad airflow can make temperature climb. Monitoring temperature lets you spot overheating, cooling issues, or potential damage scenarios.
Why Both Matter Together
High usage + high temperature = risk.
High usage + low temperature = good, efficient hardware.
Low usage + high temperature = warning: likely poor cooling or background load.
So when you monitor both usage and temperature you get a fuller picture.
The Tools You Should Use

There are a variety of free and paid tools, and I’ll highlight some of the best for monitoring CPU/GPU temperature and usage.
1. HWMonitor / HWInfo
HWMonitor and its counterpart HWInfo are great general-purpose tools. They display temperatures, voltages, usage, and more in one place. Example tutorials show how to use HWMonitor for PC monitoring.
2. MSI Afterburner (with RivaTuner Statistics Server)
Originally targeted at GPU overclockers, MSI Afterburner is now a go-to for real-time usage, temperature, overlay monitoring of both CPU and GPU. For example: “How to Monitor CPU and GPU Temperatures While Gaming?” uses Afterburner.
3. Core Temp
This is a lightweight utility focusing on CPU core temperatures. For quick checks it does the job.
4. GPU‑Z
Especially useful for GPU specifics: memory clocks, fan speeds, temperature, usage. It complements a general tool like HWMonitor.
Step-by-Step Guide to Monitor CPU/GPU Usage & Temperature
Step 1: Choose and install your tool
-
Download and install HWMonitor or HWInfo for a full view.
-
Install MSI Afterburner + RivaTuner if you want in-game overlays or advanced usage.
-
Optionally install Core Temp or GPU-Z for focused readings.
Step 2: Launch and observe baseline idle readings
Once installed:
-
Reboot your PC so everything starts fresh.
-
Open your monitoring tool, let your PC sit idle for 10-15 minutes.
-
Record the baseline: CPU usage %, GPU usage %, CPU temperature, GPU temperature.
If your idle temperature is already high (for example above ~40-50 °C for CPU or ~45-55 °C for GPU depending on hardware), investigate cooling.
Step 3: Monitor during load
Now challenge your PC:
-
Play a game, run a rendering task, or other heavy workload.
-
Watch usage climb (CPU and/or GPU) and watch temperature rise.
-
Pay attention: Does usage hits 90-100 %? Does temperature go into dangerous range (often above 85-90 °C)??
Step 4: Set alerts or thresholds if supported
Some tools permit logging or alerts. You can set a temperature threshold (say 90 °C) to notify you if exceeded. This helps proactive maintenance.
Step 5: Interpret results and act
If you see:
-
High usage but moderate temperature: Your cooling is adequate. Good sign.
-
High usage and high temperature: Consider better cooling, more airflow, check fans, dust.
-
Low usage but high temperature: Something is wrong: possible poor airflow, stuck fan, dust build-up.
-
High temperature spikes in short bursts: Normal. But if sustained, risk of throttling.
Also read: Do you need 2 GPUs 3 monitors?
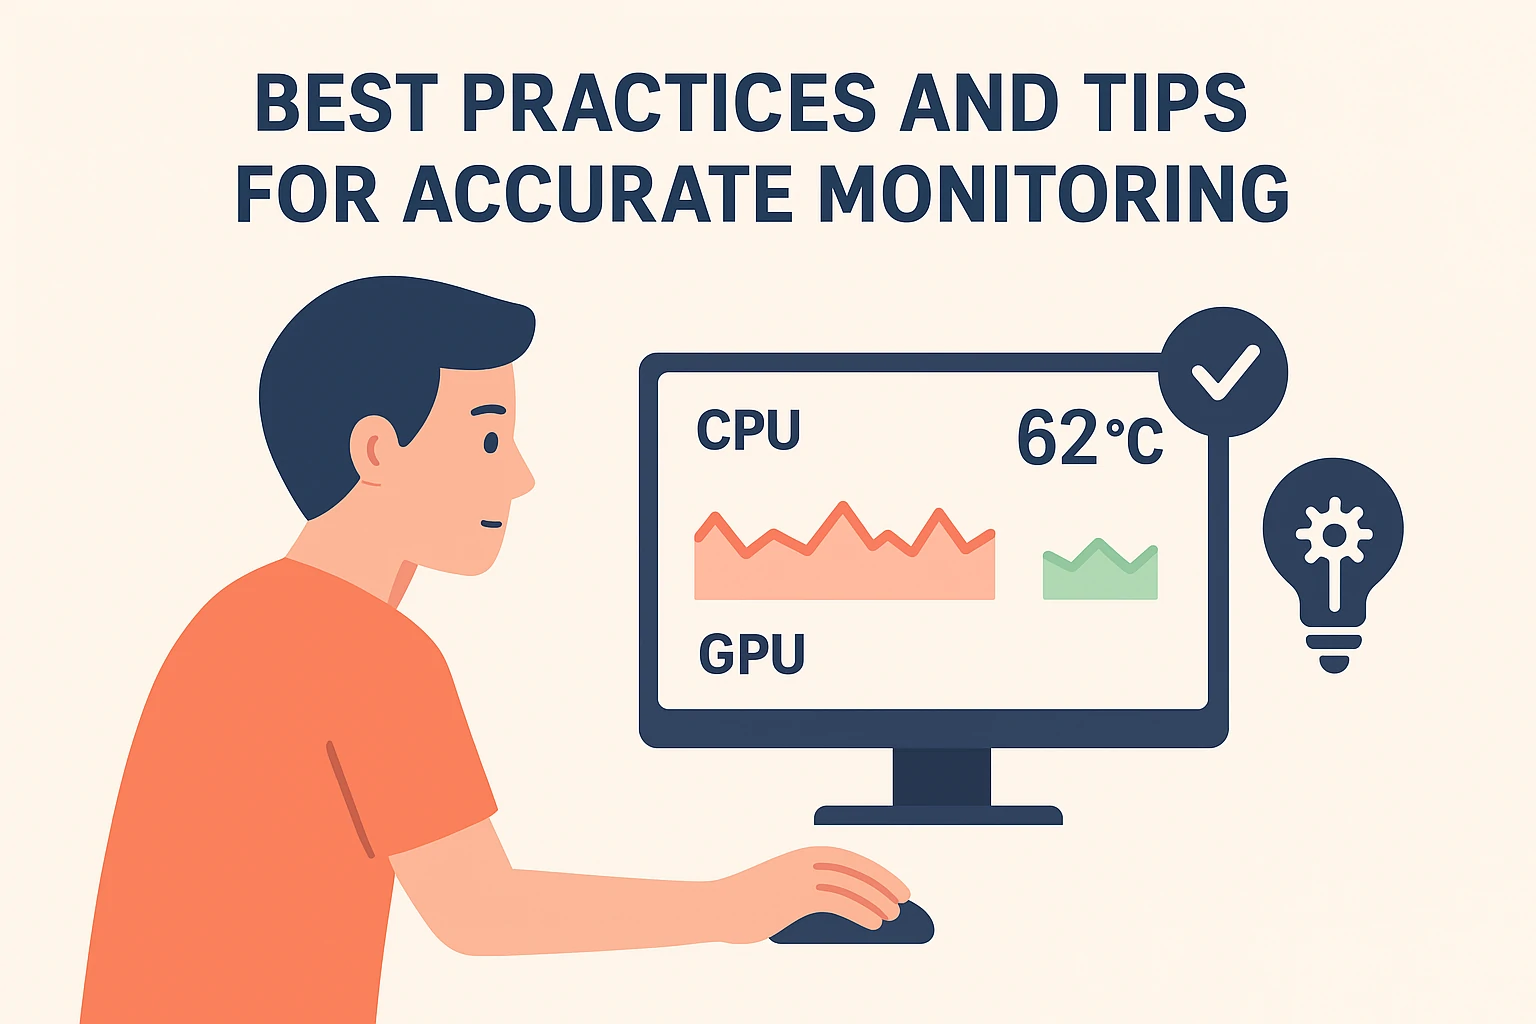
Best Practices and Tips for Accurate Monitoring
-
Make sure your PC’s cooling system is clean: dust-free fans, proper thermal paste, unobstructed airflow.
-
Keep drivers updated, especially GPU drivers, since outdated drivers may cause excessive usage and heat.
-
Use monitoring tools that run in background or overlay so you can observe during real use, not just benchmarks.
-
For laptops, using built-in sensors may vary; prefer tools that support your specific hardware.
-
Use logging to notice trends: if your idle temp gradually rises over time, it may indicate degradation or dust.
-
Frequent high temps shorten hardware life; try to keep CPU under ~85-90 °C and GPU under ~80-85 °C for sustained loads (depending on model).
-
For gamers: enable in-game overlay to see temps and usage without Alt-Tabbing away.
-
Be aware of ambient room temperature: a hot room will raise your PC’s baseline.
Common Mistakes to Avoid
-
Relying only on usage metrics without checking temperature. Usage may be fine but temperature may be dangerously high.
-
Ignoring idle temps: A high idle temperature suggests inefficient cooling or hardware issue.
-
Running monitoring software that itself uses high resources: some heavy monitoring tools may themselves add load—choose efficient ones.
-
Not monitoring both CPU and GPU: Many believe only GPU matters for games, but modern CPUs also generate significant heat.
-
Not adjusting monitoring when hardware or environment changes: e.g., adding a new GPU, using a new case, or moving to a warmer room—all can affect temps.
SEO Optimization Notes
-
Keywords: „monitor CPU temperature“, „monitor GPU usage“, „PC temperature monitoring“, „CPU GPU usage monitoring“, „PC performance monitoring tool“.
-
Use keywords naturally in headings, first paragraph, and throughout the post.
-
Ensure meta title and description incorporate primary keyword (“monitor CPU temperature” or “monitor GPU usage”).
-
Use sub-headings (H2) as above to structure content for readability and search engine scanning.
-
Add internal links (as above) to retain users on your site and increase dwell time.
-
Optimize images with descriptive alt text (see suggestions below) and compress them for fast loading.
-
Include a call-to-action at the end of the post: e.g., “Download your monitoring tool today”, “Subscribe for more hardware optimization tips”, or “Share your cooling setup in the comments”.
-
Provide value: as this post does by guiding the user through steps, offering tips, avoiding mistakes. Search engines favour useful, in-depth content.
-
Ensure the article is mobile-friendly and loads fast — necessary for modern SEO.
Final Thoughts
Monitoring CPU and GPU temperature and usage is no longer optional—it’s essential if you want your PC to perform reliably and last longer. Whether you’re gaming, content-creating, or just doing everyday tasks, knowing what your hardware is doing gives you control.
Install a trustworthy monitoring tool, check your baseline idle readings, monitor under load, act on signs of trouble (high temps, high usage with little output), and you’ll protect your investment. On the ADCOD site we aim to empower you with practical tech know-how so you can get the most from your machine. Stay vigilant, stay cool.
Also read: Do multiple monitors strain GPU?